The Road to FIRE - Stress Testing My Plan Against History
There is no guarantee what the future will hold, so when planning for our financial future, we can look back at history and replay our finances in that context and see what would happen. In this post I will answer whether my retirement will survive 111 years of historical data using pessimistic scenarios to achieve a 98% success rate.
I am using a tool that I was able to get free access to during my time working in financial services, it allows me to act as a financial coach and plug in one set of client details. It just so happens that client is me.
So I’ve plugged in my income, my assets, my planned expenditure from now until retirement and beyond and set an aggressive 48 target compared to my other post where 50 looks much more comfortable.
Historical Risks Captured
The data this tool uses has captured 7 major wars, including the two world wars. Hyperinflation - this is where inflation has hit double digits - has hit over a dozen times in the last 111 years, it covers pandemics such as the spanish flu, SARS, Ebola and of course Covid-19 as well as many other world events
My Data
Here is a high level summary of the data used. It assumes from 2026 until retirement I will contribute a total of £20k into my pension (including employer contributions and tax relief via a salary sacrifice scheme) per year, £20k in to my S&S ISA per year - both in the highest risk global equity fund available.
It assumes inflation is applied uniformly across fund growth, expenses and salary.
It also allows me to plan where my withdrawals come from and in which order ISA -> WPP -> SIPP -> onwards. The ISA acting as my retirement bridge until pensions are available at 58 and then my pensions sustaining the next decade until I can add my DB and State pension to the mix.
| Type | Value |
|---|---|
| Current Age | 43 |
| Stocks and Shared Individual Savings Account (ISA) | £147k |
| Work place pension (WPP) | £46k |
| Self invested personal pension (SIPP) | £157k |
| Defined Benefit (DB) Pension | £9.5/y |
| State Pension | £12.5/y |
| Retirement Age | 48 |
| Pension Access Age | 58 |
| DB & State Pension Access Age | 68 |
Risk
Risk is running out of money and depleting my pots too soon on each phase of my retirement such that I would be forced to return to some sort of employment to cover costs.
As such I’ve used the tool on pessimistic mode there is also median and optimistic. Pessimistic is the 30th percentile, median is 50th and optimistic 70th. So by choosing the 30th percentile and a pessimistic approach this should cater for a bad return or sequencing risk.
Note: These real historical scenarios cover both incomes and withdrawals, so in some cases, a more optimistic scenario might have lower incomes in real terms than the other scenarios, but including withdrawals, is still more optimistic.
My outcomes
My plan made it to the end in 98.2% of scenarios, based on 649 scenarios across the last 111 years of history. In just 12 of 649 scenarios did my plan need some sort of adjustment - this might be cutting back on spending for a few years, perhaps seeking a part time job to tick over until the markets recovered. But from my risk tolerance, and yours may vary, this is fine for me.
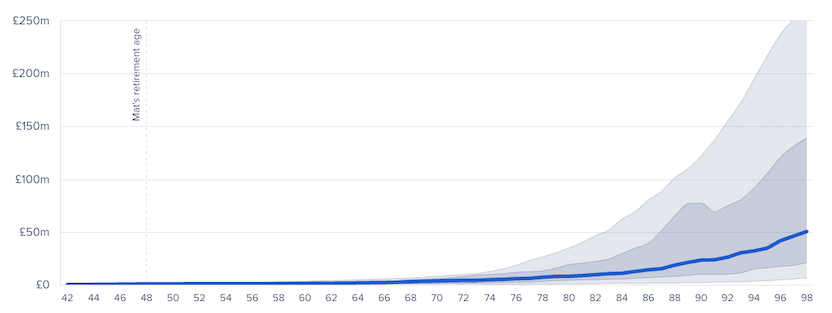
The charts in the tool show that in some scenarios my net worth could reach a nominal £150m by age 93 (2076) albeit an outlier. This is if markets are good and money stays invested and compounding for another 50 years. The median outcome (dark blue line) based on the historical data is a nominal £30m net worth at age 93. I am certain in any cases like this any surplus available during my retirement will be an increase my discretionary spend.
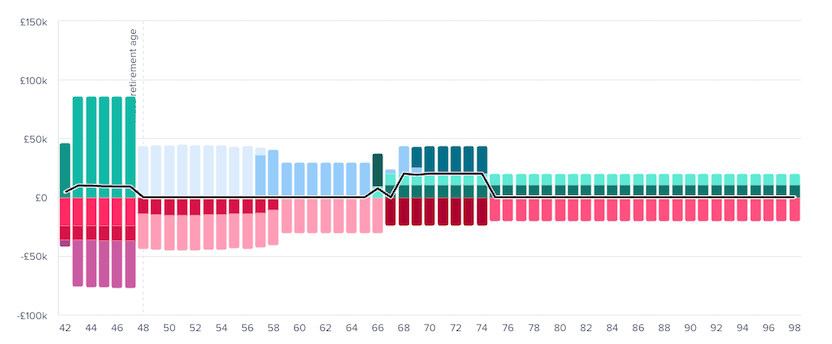
This chart shows my cashflow during my retirement, with high income as I work, no income as I live off the ISA, before my pension withdrawals kick in, my mortgage drops off and the withdrawals from my pensions (these are shown at net, tax adjusted) equal my expenditure and as my DB and State pension kicks in there is an increase in cashflow before tailing off to live at my means until the end.
notes:
- My entire process ignores my spouse’s income and pensions as that will just be bonus funds for us to enjoy along the way.
- The chart uses the government access rules as they are today, such that it shows my pension being withdrawn at 57, but it will be 58 by the time I get there and all my figures are with this in mind. I will continue to update figures in here every year and adjust plans accordingly.
-
There is no guarantee what the future will hold, so when planning for our financial future, we can look back at history and replay our finances in that conte…
Continue reading at thechels.uk.